EVM Debugging
The EVMDebuggerSession provides interactive, source-level debugging of EVM execution. You can step forward and backward through execution, see which Solidity source line corresponds to each EVM instruction, inspect decoded function calls, and navigate to specific steps — similar to a traditional debugger but for smart contract execution.
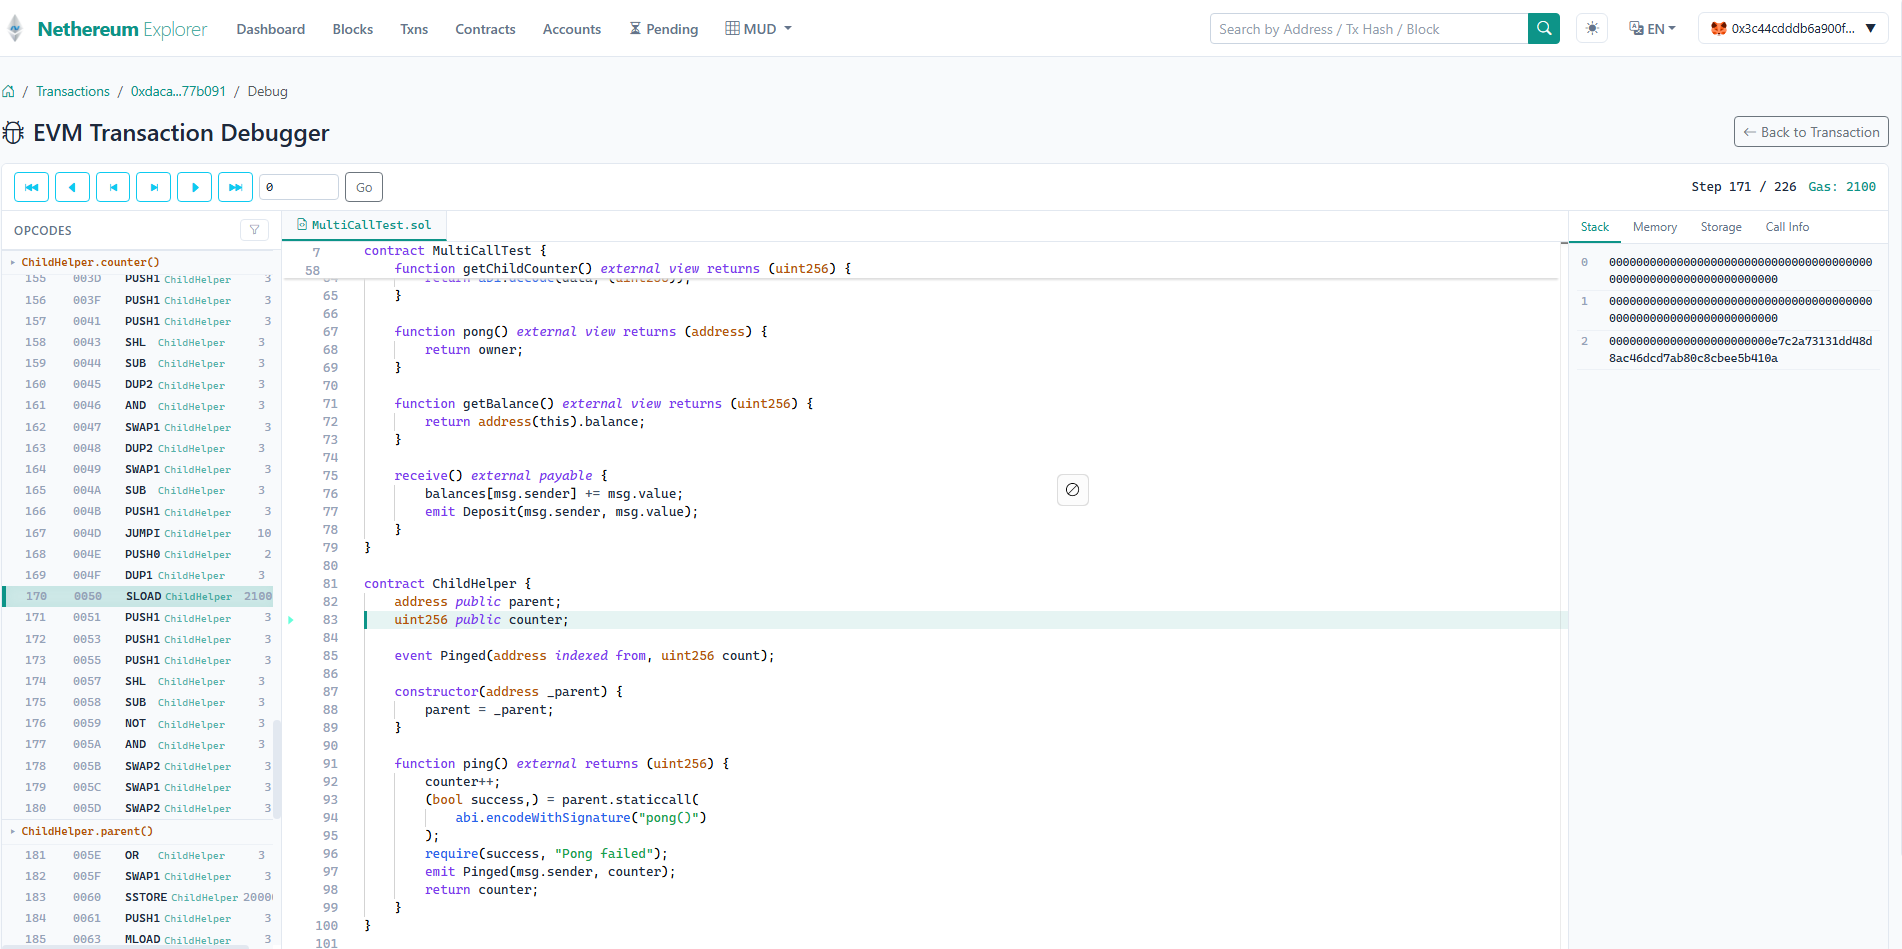
The Nethereum Blazor Solidity debugger (Nethereum.Blazor.Solidity) builds its UI on top of this API, replaying on-chain transactions and mapping bytecode back to Solidity source code.
Prerequisites
dotnet add package Nethereum.EVM
For source-level debugging with Solidity source maps, you also need compiled contract artifacts (ABI + source maps + source code). The Nethereum.Blazor.Solidity package provides EvmDebugService which handles artifact matching automatically.
Creating a Debug Session
A debug session wraps a Program that has been executed with tracing enabled:
using Nethereum.EVM;
using Nethereum.EVM.Debugging;

// First, execute with tracing
var vm = new EVMSimulator();
var program = new Program(contractCode, context);
await vm.ExecuteAsync(program, traceEnabled: true);

// Create debug session
var session = new EVMDebuggerSession(program);
The session provides navigation over the recorded trace — it doesn't re-execute instructions. All stepping is instant.
Stepping Through Execution
Navigate the execution trace like a traditional debugger:
// Step forward one instruction
session.StepForward();

// Step backward
session.StepBack();

// Jump to a specific step
session.GoTo(42);

// Get current position
var currentStep = session.CurrentStep;
var totalSteps = session.TotalSteps;
Console.WriteLine($"Step {currentStep} of {totalSteps}");
Because the trace is pre-recorded, stepping backward is instant — no re-execution needed.
Source-Level Debugging
When source maps are available, you can map each EVM instruction to its Solidity source location:
// Get the Solidity source location for the current step
var sourceLocation = session.GetSourceLocationForStep(session.CurrentStep);

if (sourceLocation != null)
{
    Console.WriteLine($"File: {sourceLocation.FileName}");
    Console.WriteLine($"Line: {sourceLocation.Line}");
    Console.WriteLine($"Column: {sourceLocation.Column}");
    Console.WriteLine($"Length: {sourceLocation.Length}");
}

// Get the function name for the current step
var functionName = session.GetFunctionNameForStep(session.CurrentStep);
Console.WriteLine($"Function: {functionName}");
Source maps come from the Solidity compiler output. The Nethereum.Blazor.Solidity debugger service matches deployed bytecode to local compiled artifacts to obtain these maps.
Decoded Call Information
At any step, you can get the decoded function call context:
var callInfo = session.GetCallInfoForStep(session.CurrentStep);

if (callInfo != null)
{
    Console.WriteLine($"Contract: {callInfo.ContractAddress}");
    Console.WriteLine($"Function: {callInfo.FunctionName}");
    Console.WriteLine($"Depth: {callInfo.Depth}");
}
This is particularly useful for understanding which contract and function is executing at any point during a complex multi-contract interaction.
Finding Steps for a Source Line
If you want to set a "breakpoint" on a specific Solidity source line:
var steps = session.FindStepsForSourceLine(fileName, lineNumber);

foreach (var step in steps)
{
    Console.WriteLine($"Step {step} maps to line {lineNumber}");
}

// Navigate to the first match
if (steps.Any())
{
    session.GoTo(steps.First());
}
Getting All Source Files
Retrieve all Solidity source files associated with the debug session:
var sourceFiles = session.GetAllSourceFileContents();

foreach (var (fileName, content) in sourceFiles)
{
    Console.WriteLine($"--- {fileName} ---");
    Console.WriteLine(content);
}
Debug Output
For a formatted text dump of the current debug state:
var debugOutput = session.ToDebugString();
Console.WriteLine(debugOutput);
This includes the current instruction, stack state, memory, storage, and source location.
Transaction Replay with Blazor Solidity
The EvmDebugService in Nethereum.Blazor.Solidity provides a higher-level API for replaying on-chain transactions:
// In the Blazor Solidity debugger:
var debugService = new EvmDebugService(web3, compiledArtifacts);

// Replay an on-chain transaction
var replayResult = await debugService.ReplayTransactionAsync(txHash);

if (replayResult.HasSourceMaps)
{
    var session = replayResult.Session;
    Console.WriteLine($"Total steps: {replayResult.TotalSteps}");
    Console.WriteLine($"Reverted: {replayResult.IsRevert}");

    // Source files available for display
    foreach (var file in replayResult.SourceFiles)
    {
        Console.WriteLine($"Source: {file}");
    }
}
The replay service:
- Fetches the transaction and its pre-state block
- Simulates execution with the local EVM (
ExecuteWithCallStackAsync) - Falls back to
debug_traceTransactionif the local simulation fails - Matches deployed bytecode to compiled artifacts for source mapping
- Handles multi-contract transactions — discovers all code addresses and matches each to its source
Next Steps
- Bytecode Execution — lower-level opcode execution without source maps
- Bytecode Disassembly — analyze bytecode structure and function signatures
- Transaction Simulation — simulate transactions to produce the data that debugging sessions analyze